
Africa’s Hunger Divide: Nigeria Accounts for 55% of Severe Food Insecurity Across 14 Countries
Nukunya's analysis of AGRA's October 2026 data finds Nigeria accounts for 55.4% of severe food insecurity across 14 monitored countries, while South Sudan has the highest incidence.

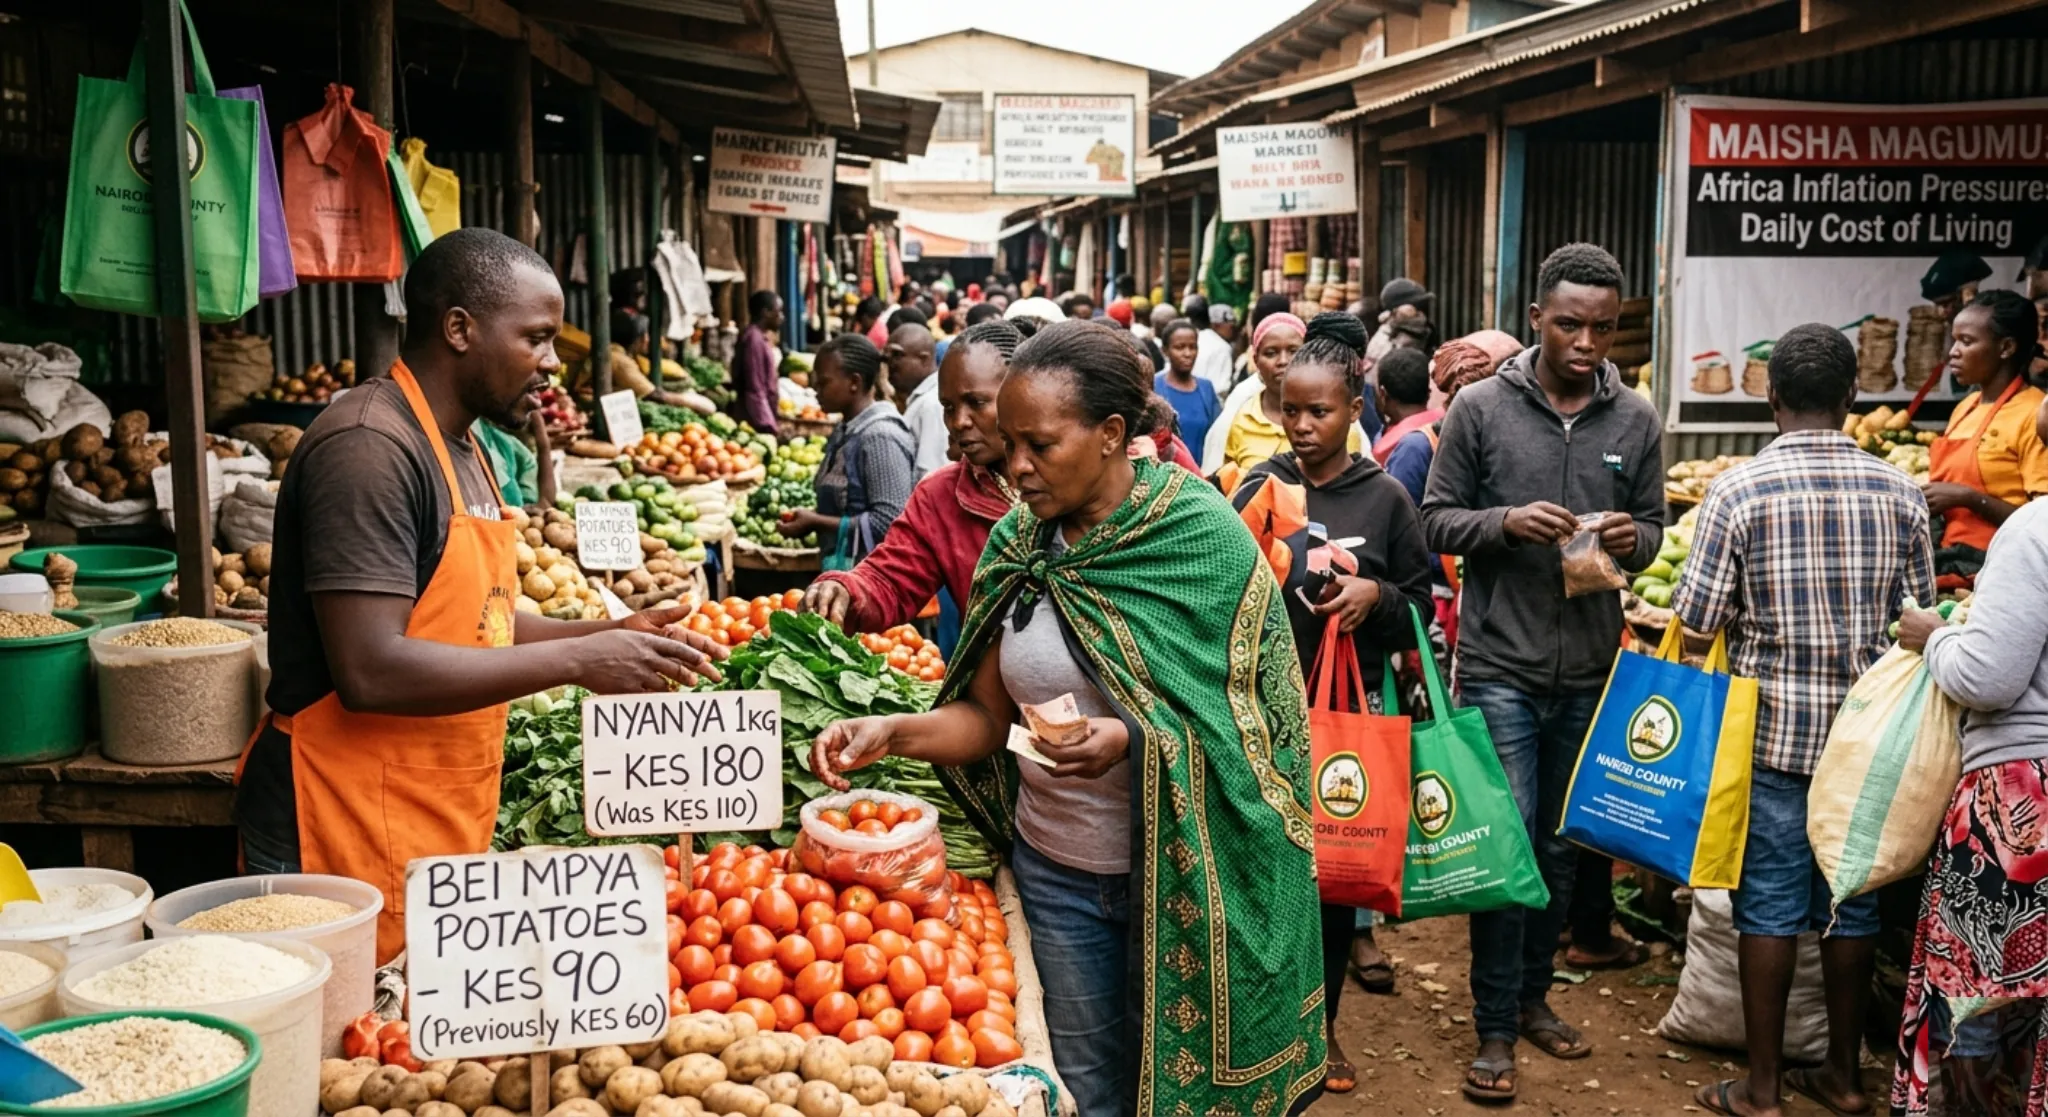

Nigeria accounts for more than half of the 65.46 million people facing Crisis-level or worse food insecurity across 14 African countries in AGRA’s latest monitoring table. Nukunya’s analysis of the original figures reveals a second reality: South Sudan has the highest proportional burden, while falling grain prices have not eliminated severe hunger.
Accra — More than 36.28 million people in Nigeria face Crisis-level or worse food insecurity, making the country responsible for 55.4% of the total across 14 countries in the October 2026 Food Security Monitor published by AGRA.
That share is Nukunya’s calculation from the report’s country-level data, not an estimate of Nigeria’s share of hunger across the whole African continent. The monitored-country total is 65,464,941 people; Nigeria accounts for 36,289,939, exceeding the combined 29,175,002 in the other 13 countries by 7,114,937.
But ranking countries by absolute numbers tells only part of the story. In South Sudan, 55% of the population covered by the assessment faces the same severity of food insecurity, compared with 16.65% in Nigeria. A country can have fewer people in crisis while experiencing a much more pervasive emergency among those assessed.
The numbers behind Africa’s hunger divide
36.29m
55.4%
55%
36.29m
7.83m
2.94m
2.61m
2.55m
2.50m
2.42m
1.84m
AGRA’s table draws on World Food Programme data and uses IPC/Cadre Harmonisé Phase 3 or equivalent classifications. At Phase 3, households face serious gaps in food consumption or must use damaging coping strategies to meet basic needs. It is not the same as saying every person counted is in famine, which has a much more specific technical definition.
Africa’s food security crisis, in numbers
Explore reported acute food insecurity across 14 countries in AGRA’s October 2026 Food Security Monitor.
Where is food insecurity greatest?
Switch between absolute numbers and incidence. These measures answer different questions.
Nigeria
The full interactive chart loads when JavaScript is enabled.
Incidence percentages use country-specific assessed populations. They are not shares of Africa’s population and must not be added together.
Nigeria and South Sudan tell different stories
People in Phase 3+
16.65%Of assessed population
People in Phase 3+
55%Of assessed population
Nigeria has approximately 4.6 times South Sudan’s affected count, while South Sudan’s reported incidence is about 3.3 times Nigeria’s.
Nigeria: lower commodity prices, persistent food insecurity
Maize
Approximately 7.5% lower
Rice
Approximately 10.6% lower
AGRA-reported commodity prices in US dollars per metric tonne, not household retail food-basket costs. The reported national Phase 3+ estimate for Nigeria did not change from September.
Two changes warrant closer scrutiny
Reported change from September
October count: 2,940,124Reported change from September
October count: 2,548,552These changes are reproduced from the source table. Differences in coverage, assessment periods or methodology have not been ruled out. Do not interpret Uganda’s percentage as a verified count of newly affected people.
What should governments explain?
Are falling food prices reaching households?
Publish comparable retail food-basket costs and purchasing-power measures, not only selected commodity averages.
Which communities are missing from assessments?
Disclose subnational coverage and access limitations, especially in conflict-affected areas.
Is assistance reaching those in greatest need?
Report delivery, beneficiaries, unmet needs and funding gaps against assessed requirements.
What explains Uganda’s reported 337% increase?
Reconcile the September and October estimates, including any changes in geography, classification or projection period.
Can future changes be compared reliably?
Maintain consistent definitions and coverage, and disclose breaks in the series.
Related posts:
 Chimamanda Adichie Says Lagos Hospital Delayed Inquiry Into Son’s Death
 Ghana seeks AU intervention over xenophobic attacks in South Africa
 Nigeria seeks compensation from South Africa over migrant property losses
 Nigeria court sentences pastor to death over daughter’s murder
 Nigeria Suicide Bill: Tinubu Moves to Decriminalize Attempted